readRDS(url("https://github.com/sakeefkarim/intro_quantitative_sociology/raw/refs/heads/main/data/assignments/coding%20assignment/gss_2010_truncated.rds"))SOCI 269
An Introduction to Quantitative Sociology
Coding Assignment
Sakeef M. Karim
Amherst College
Basic Expectations
As noted in your syllabus, you are required to submit a short coding assignment by Monday, March 10th at 8:00 PM. For this assignment, you will clean a dataset in , report basic descriptive statistics, and create simple data visualizations. You must also include your script file (i.e., a .R document) as part of your submission. Once you’re done, please submit your materials via Moodle.
You Must Submit Two Separate Files
Please remember to submit (i) the code you used to complete the assignment along with (ii) a text-based summary of your results.
The Data
Description
You will be working with a truncated version of the 2010 General Social Survey (henceforth, GSS). The dataset was prepared using the {gssr} package in .
You can access the data through one of three channels:
- By copying and pasting the script below directly into RStudio:
By downloading the
.rdsfile.By cloning our companion GitHub repository.
Variables
Learn more about the variables in your data by using the interactive table embedded below. This table includes data on all variables with labels in the broader (i.e., non-coarsened) 2010 GSS.
Your Tasks
- Report the mean for all numeric variables in the data—with and without weights.1
Report the median age of all respondents by race and sex. Concretely, your estimates should provide the median age of Black women, “Other” men etc. These results do not have to be weighted. That said, if you want to generate weighted medians, feel free to explore the
Hmisc::wtd.quantile()function.Report the share of respondents who are Democrats—including Independents who lean Democrat and those who do not consider themselves “strong” Democrats. Once again, these results do not have to be weighted.2
Explore the
hrsrelax,mntlhlthandphyshlthvariables. What do they refer to? Are they meaningfully patterned by age, race, religion, sex, sexuality and their many intersections? Usingggplot2, generate two simple visualizations that provide preliminary insights based on your exploratory assessments and hunches.
- What does the
letin1avariable capture? Generate a third visualization usingggplot2that illustrates howletin1amay be socially patterned.
Formatting Guidelines
You are free to prepare the exposition for your assignment in Microsoft Word, Google Docs, \LaTeX, RMarkdown or Quarto. Concretely, this means you can submit your text-based summary as a .docx file or as a . Please use complete sentences to proffer your basic arguments and interpret the results you present. To facilitate interpretation, generate simple tables or plots to summarize descriptive results (i.e., Questions 1-3.)
If you decide to include references, please use APA or ASA citation styles to manage references and bibliographies.3 More generally, you must use subheadings to organize your arguments.
Bonus
These Are Bonus Questions
You do not have to submit answers to these questions. They are bonus items for students with prior exposure to ggplot2 (or those who want more practice).
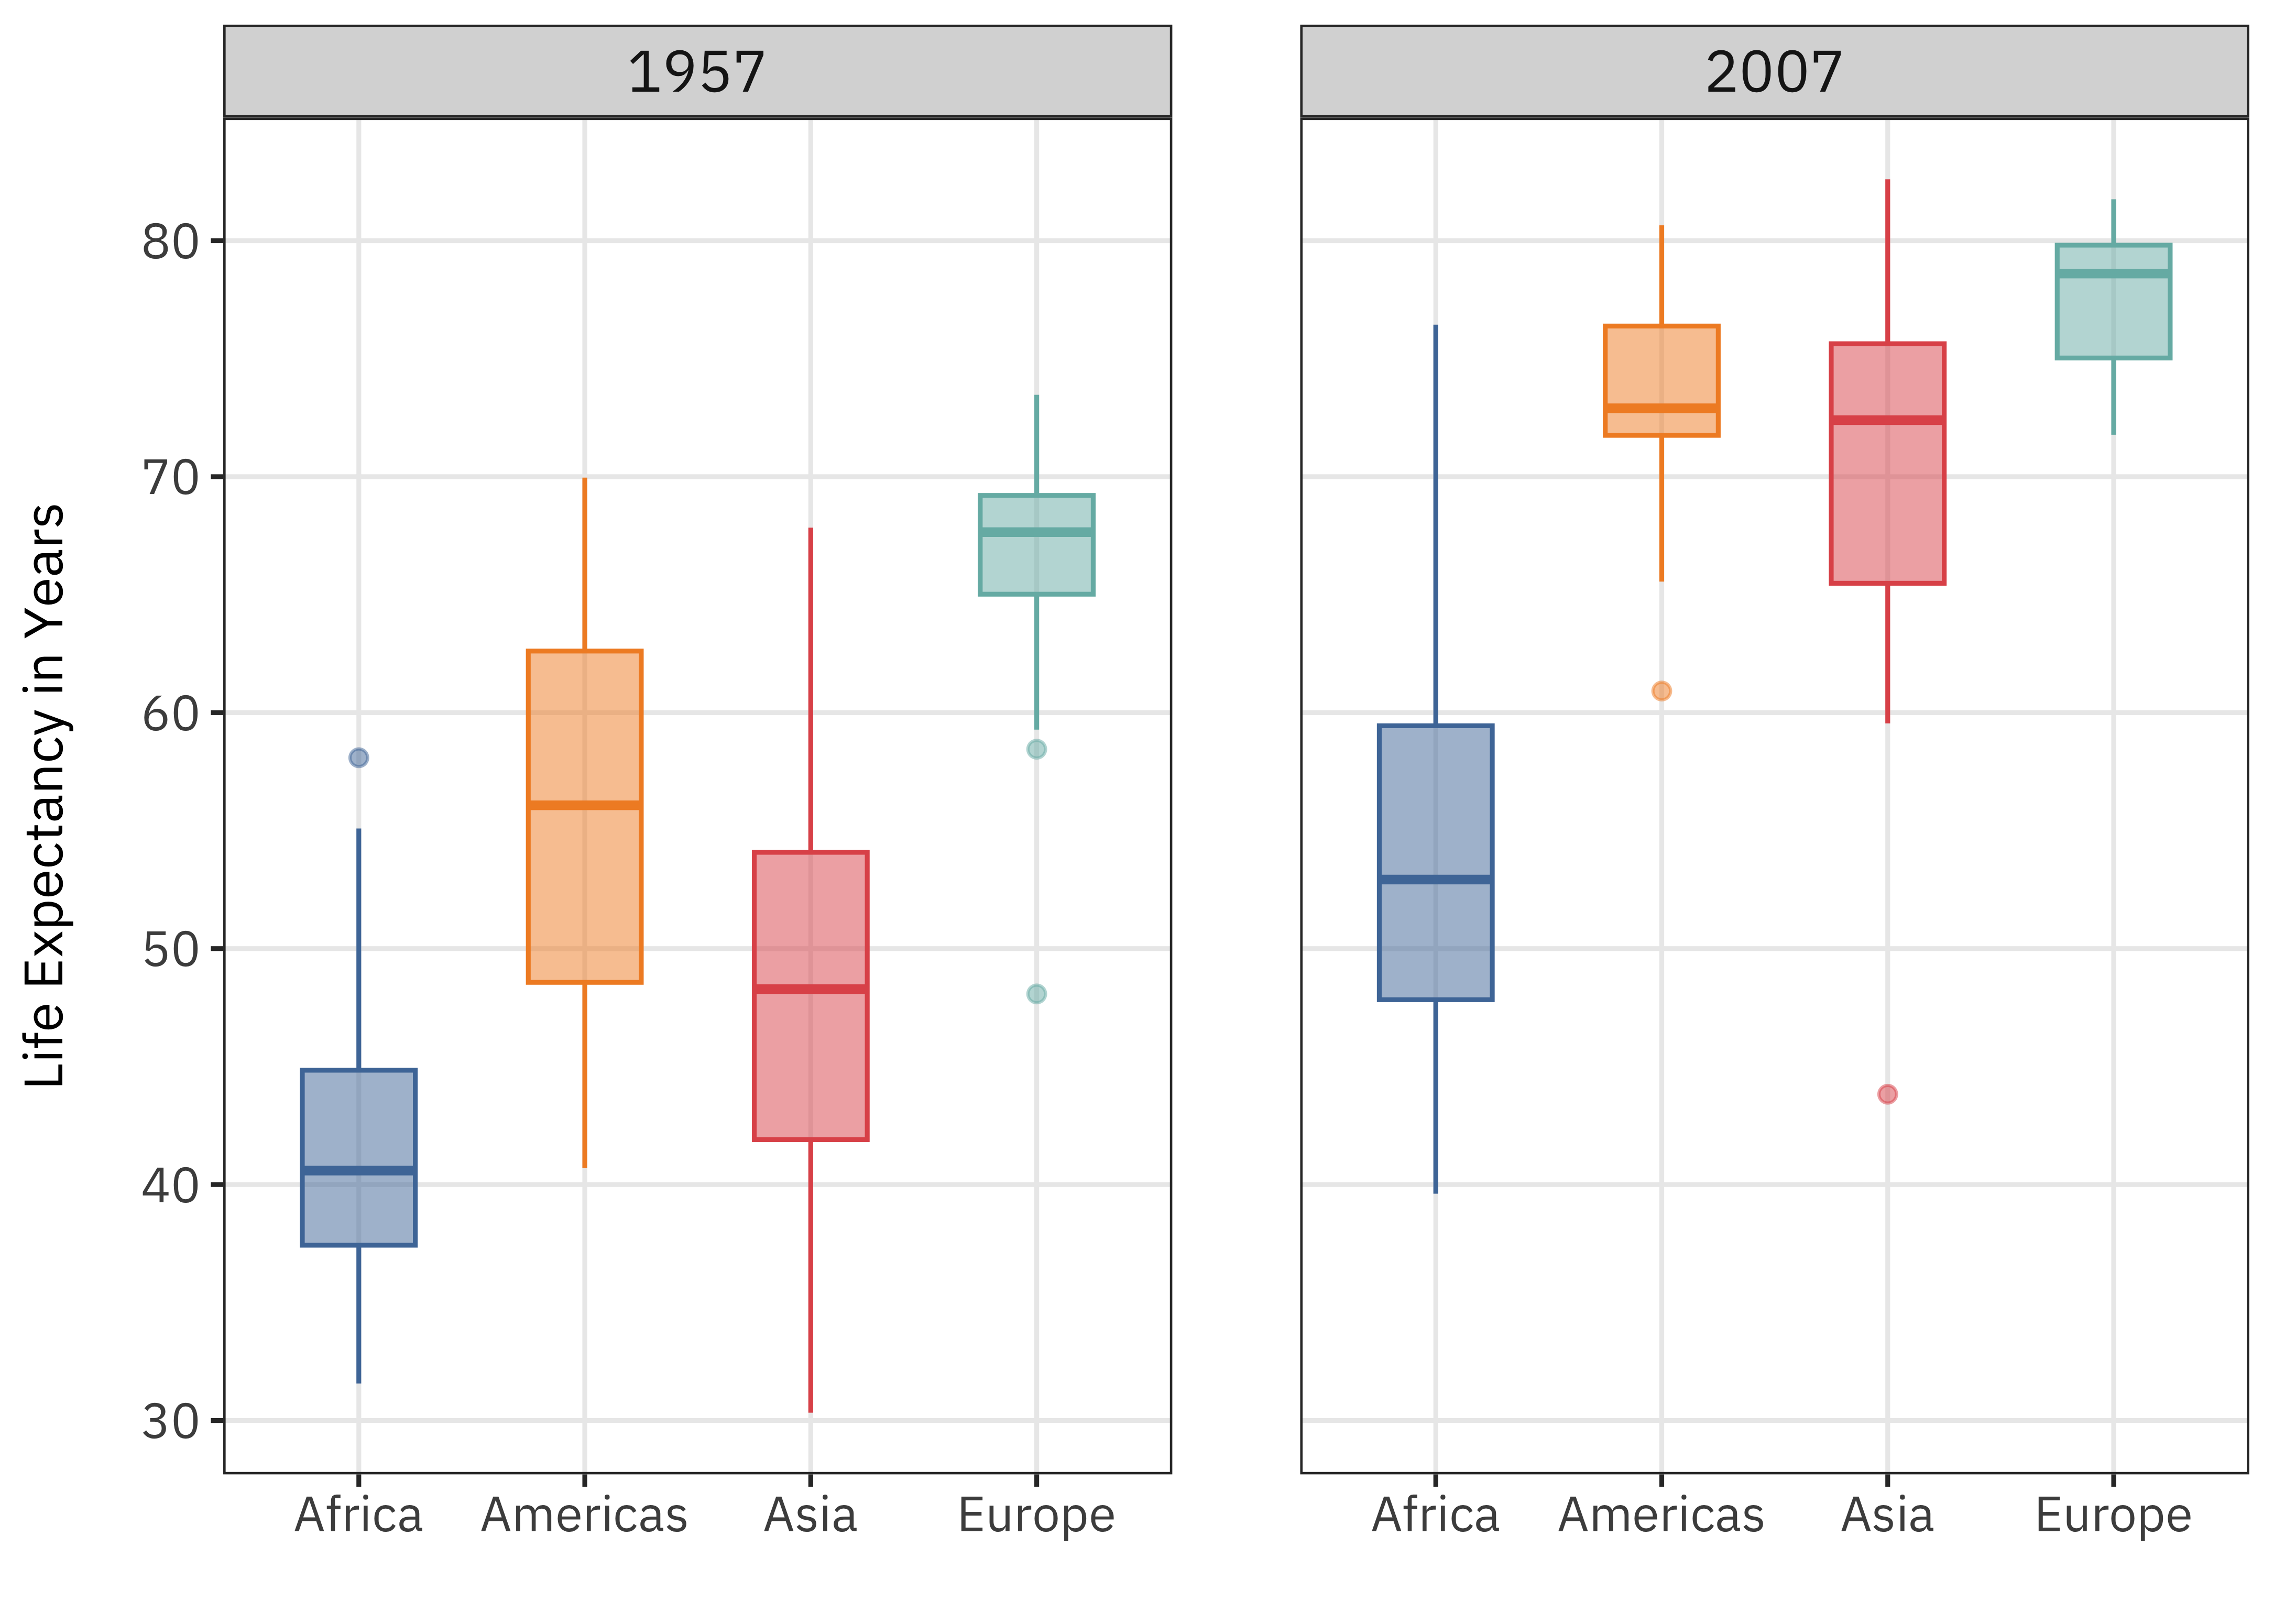
- Reproduce the plot below using
gapminderand theggthemespackage.
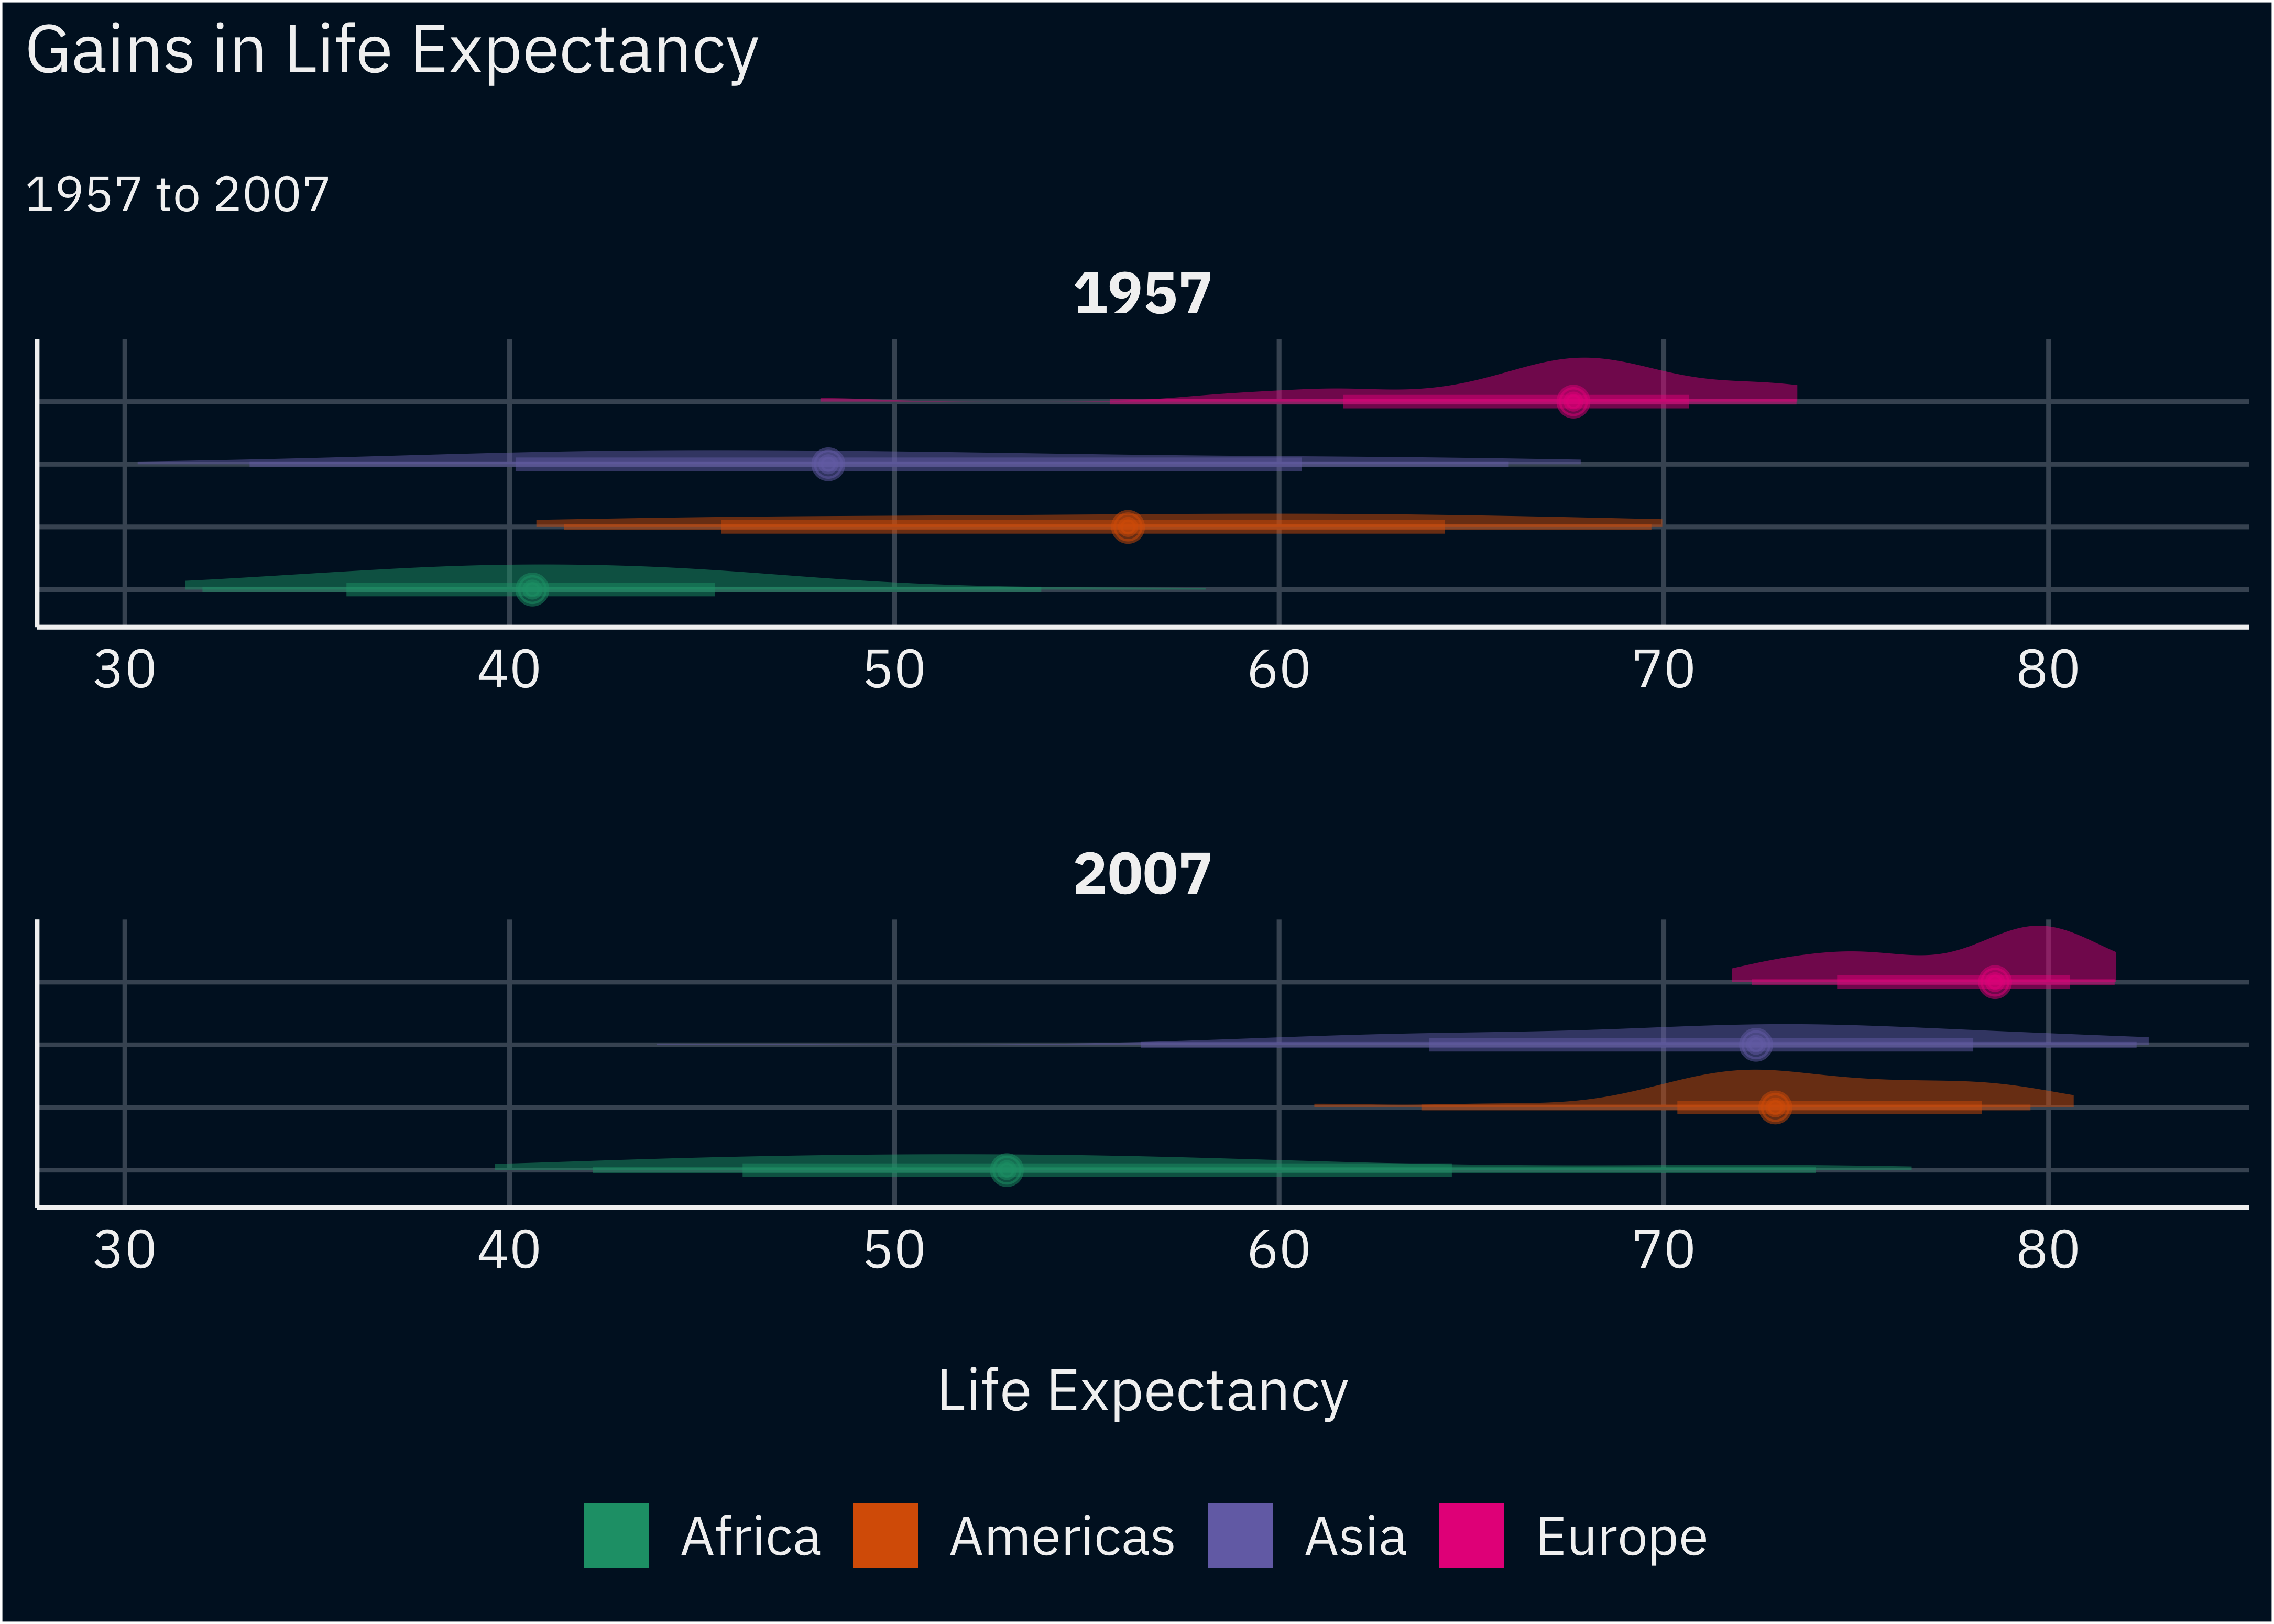
- Reproduce the plot below using the
seepackage and geom s fromggdist.
Using 2018-2022 ACS data, produce a map of Greater Boston that speaks to the racial diversity of the city.
Use
dplyrfunctions to merge the coarsened 2010 GSS (gss_2010_truncated.rds) with interesting variables from the broader 2010 GSS file (gss_2010.rds).